Introducing Mojito: Mint Metrics' open-source split testing tool


Update: We have just launched our documentation site for Mojito here.
We're excited to open source Mojito - the experimentation stack we've used to run well over 500 experiments for Mint Metrics' clients.

It's a fully source-controlled experimentation stack for building, launching and analysing experiments from your favourite IDEs.
A better way to run experiments...
Clients benefit from using Mojito over existing SaaS experimentation platforms through:
-
Faster page load times (<5kb lib)
-
Simple APIs & unlimited customisation
-
No need for 3rd party JavaScripts & data collection
-
Improved code review practices & code quality
-
Greater capacity for analytics, insights & trustworthiness
And it's free and BSD 3-Clause licensed so you know exactly what's inside it...
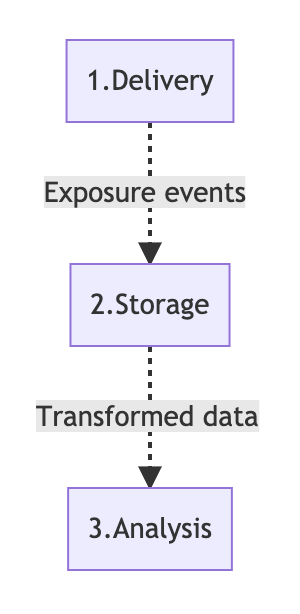
Mojito consists of three modular components
- Delivery: A front-end library for bucketing users into treatments & tracking them. (e.g. mojito-js-delivery)
- Storage: Data models & events used to make reporting faster & easier. (e.g. mojito-snowplow-storage)
- Analysis: Reporting templates and functions to make sense of experiments. (e.g. mojito-r-analytics)
Components in the stack can be swapped for alternatives. We often use our storage and analytics components with SaaS tools like Convert.com and Optimizely. Meanwhile we track experiments run through mojito-js-delivery into Google Analytics and Google Optimize.
We'll explore short summaries of each component below. Look out for future posts that describe the components in greater detail.
1. Delivery (experiment logic & variant code hosting)
This is the library that sits on your website and buckets users into tests & treatments. We forked from James Yu's excellent Cohorts JS project on Github and built upon it over the years. Some of our enhancements include a new seeded PRNG, error handling for variants, utilities for managing flicker and a full CI workflow.
Our clients love that it's a <5kb library on your server rather than a ~100kb SaaS vendor library. It's a win for page load times, security & users.
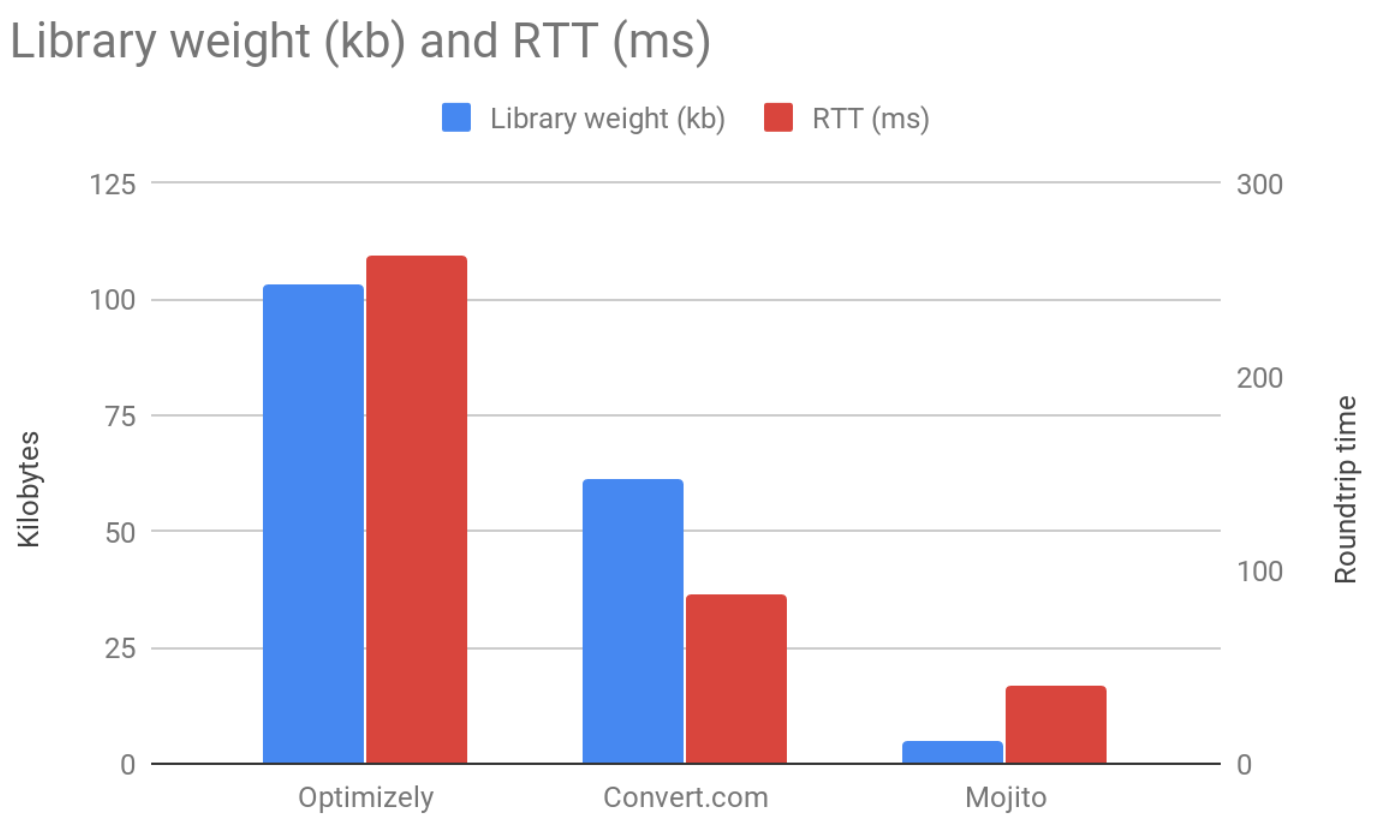
We didn't even bother splitting out the RTT and KB comparisons into separate charts because they're so apparent.
We're most proud of our modular YAML build process. You can define and prototype experiments inside a git repo with basic YAML and JS functions:
Test config (config.yml)
id: ex1
state: live
name: An experiment
sampleRate: 0.5
trigger: trigger.js
recipes:
    0:
        name: control
    1:
        name: treatment
        js: treatment.js
Trigger (trigger.js)
// Contents of trigger.js
function trigger(test) {
    // Activate treatment on the homepage
    if (document.location.pathname === '/') test.activate();
}
Variant code (treatment.js)
// Contents of treatment.js
function js() {
    // Apply after being bucketed in the treatment
    alert('Welcome to our homepage.');
}
Organise the files in a sub-folder for building
repo/
  |-- lib
    |-- waves
      |-- ex1/
        |-- config.yml
        |-- treatment.js
        |-- trigger.js
Now, build/publish your container
Bitbucket Pipelines takes care of CI for us - it builds, lints, minifies and publishes the container to AWS S3. Using deployment environments and environment variables, we can assign precise permissions for different users on our repositories.
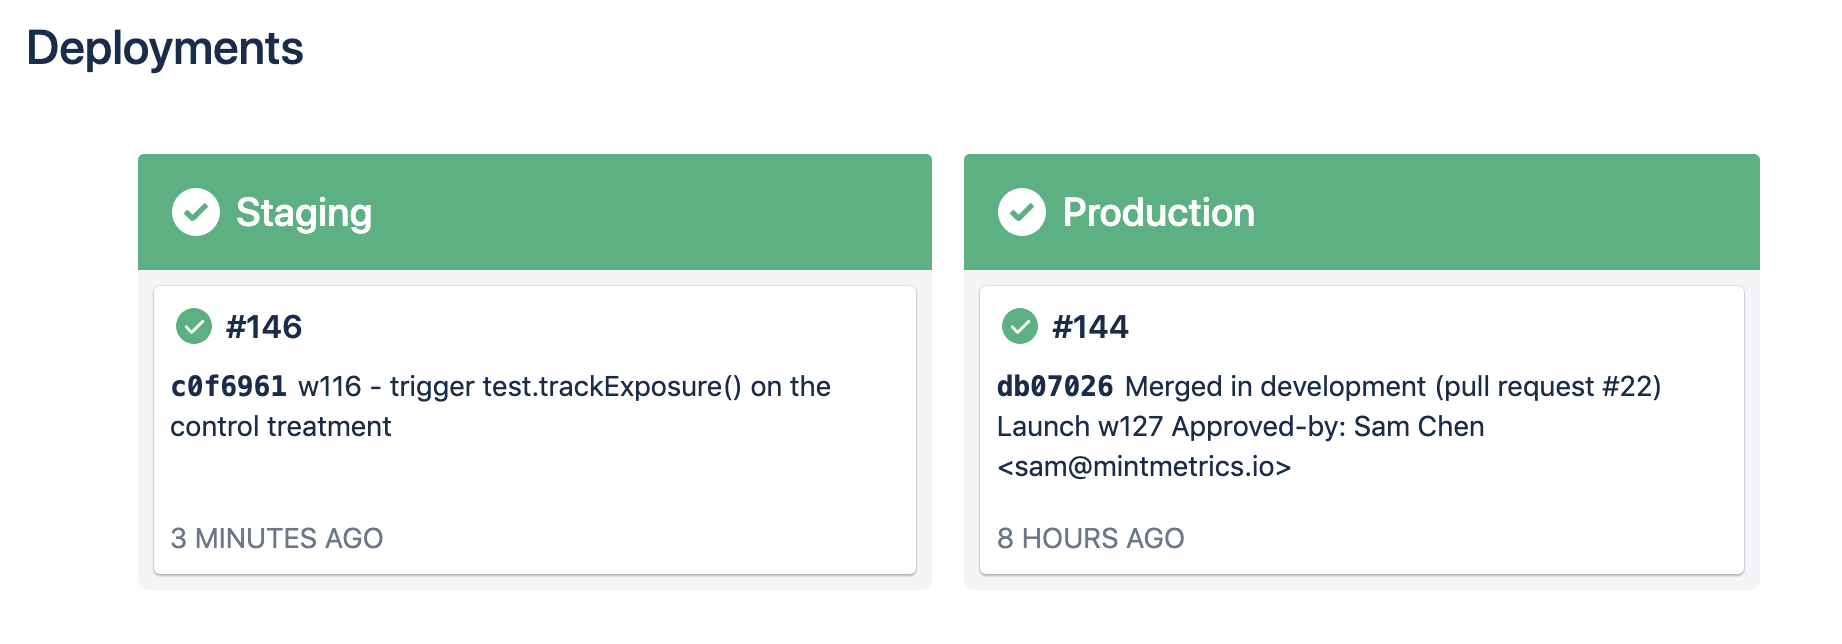
See exactly what is published to any given environment at a glance.
The build process stitches together everything inside the repository and outputs a highly minified JS container.
Get started running experiments with our Github docs.
2. Storage (data collection targets & modelling)
We support Snowplow and Redshift out of the box, but we always push data into Google Analytics for everyone to see. Storage is designed to capture three key experiment events:
- Recipe exposures - when units are exposed to a recipe (variant)
- Errors - when JS errors occur within the experiment code
- Veil timeouts - when using veil for hiding flicker, we fire an event when the timeout is exceeded and users see a fallback option - we track the assigned recipe as well as the recipe they fell back to.
You can emit these events through a custom storage adapter into your Analytics tool or tag manager of choice e.g.:
Mojito.options.storageAdapter = {
    // Track assignment and display of variants
    onExposure: function (testObject)
    {
        dataLayer.push({
            "event": "mojito exposure"
        });
    },
    // Track JS errors emitted from experiments
    onRecipeFailure: function(testObject, error)
    {
        dataLayer.push({
            "event": "mojito recipe failure"
        });
        // Perform error handling
    },
    // Track veil timeouts
    onTimeoutFailure: function (testObject, ultimateRecipe)
    {
        dataLayer.push({
            "event": "mojito veil timeout"
        });
    }
};
Use our self-describing Snowplow events. We track only the essentials - the experiment name, ID and exposed recipe. We find it's more than sufficient:
{
  "$schema" : "http://iglucentral.com/schemas/com.snowplowanalytics.self-desc/schema/jsonschema/1-0-0#",
  "self" : {
    "vendor" : "io.mintmetrics.mojito",
    "name" : "mojito_exposure",
    "version" : "1-0-0",
    "format" : "jsonschema"
  },
  "type" : "object",
  "properties" : {
    "waveId" : {
      "type" : "string"
    },
    "waveName" : {
      "type" : "string"
    },
    "recipe" : {
      "type" : "string"
    }
  },
  "additionalProperties" : false
}
Businesses shouldn't be reliant on vendors' data collection and models. The data could be wrong, contaminated by bots or unable to tie back to the metrics you ultimately care about. Worse yet, when you stop paying SaaS vendors, you lose access to your data.
We advocate tracking experiments with purpose-built analytics tools.
Read more about our events and data models for Snowplow/Redshift on Github.
3. Analytics (reports & templates)
We've written a set of fully template-able R and knitr docs to produce HTML reports. The reports reflect metrics and statistics our clients care about:
- Standard unique conversion metrics
- Ecommerce metrics
- Time to convert (from point of initial exposure)
- Sample ratio mismatch (to check assignment ratios fall within acceptable limits)
- Segmentation tools
- Loyalty conversion (e.g. subjects converted at least twice)
Since you own your data, you can build custom reports using the full power of R. Meanwhile data & reports ownership allows you to retain control over your data when you switch testing vendors.
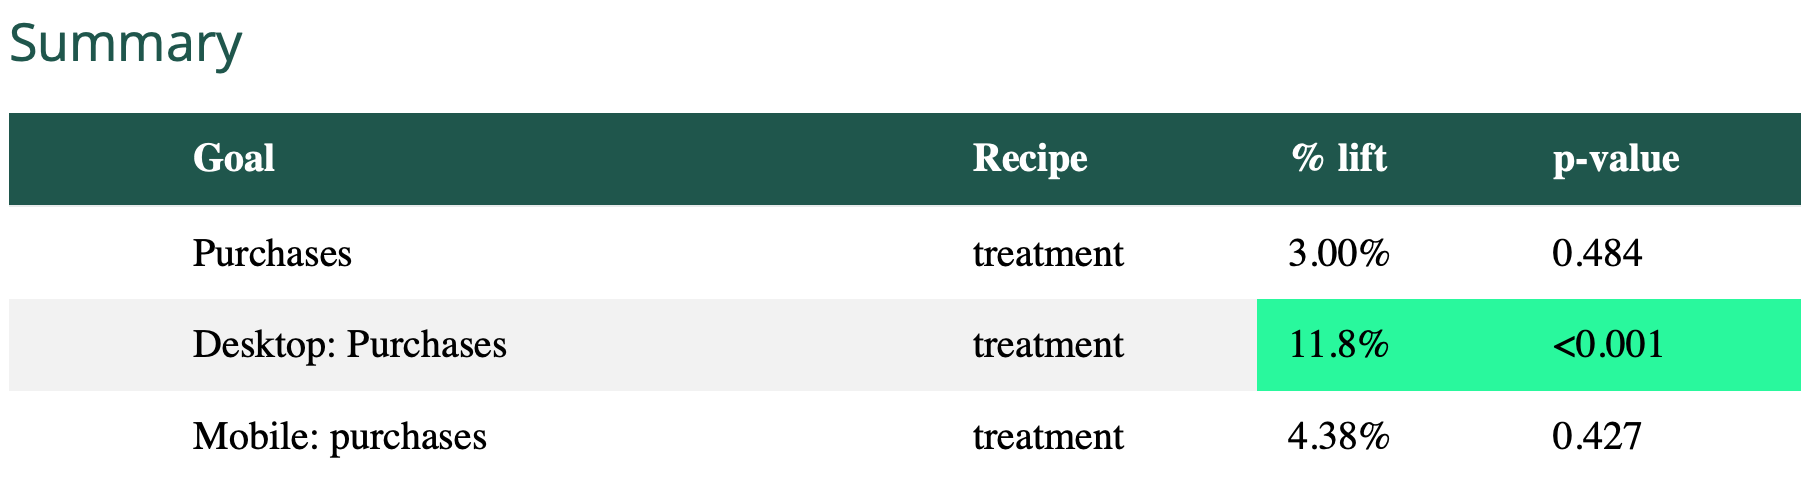
Summary scorecard of recipes' performance relative to the control for a set of metrics and segments.
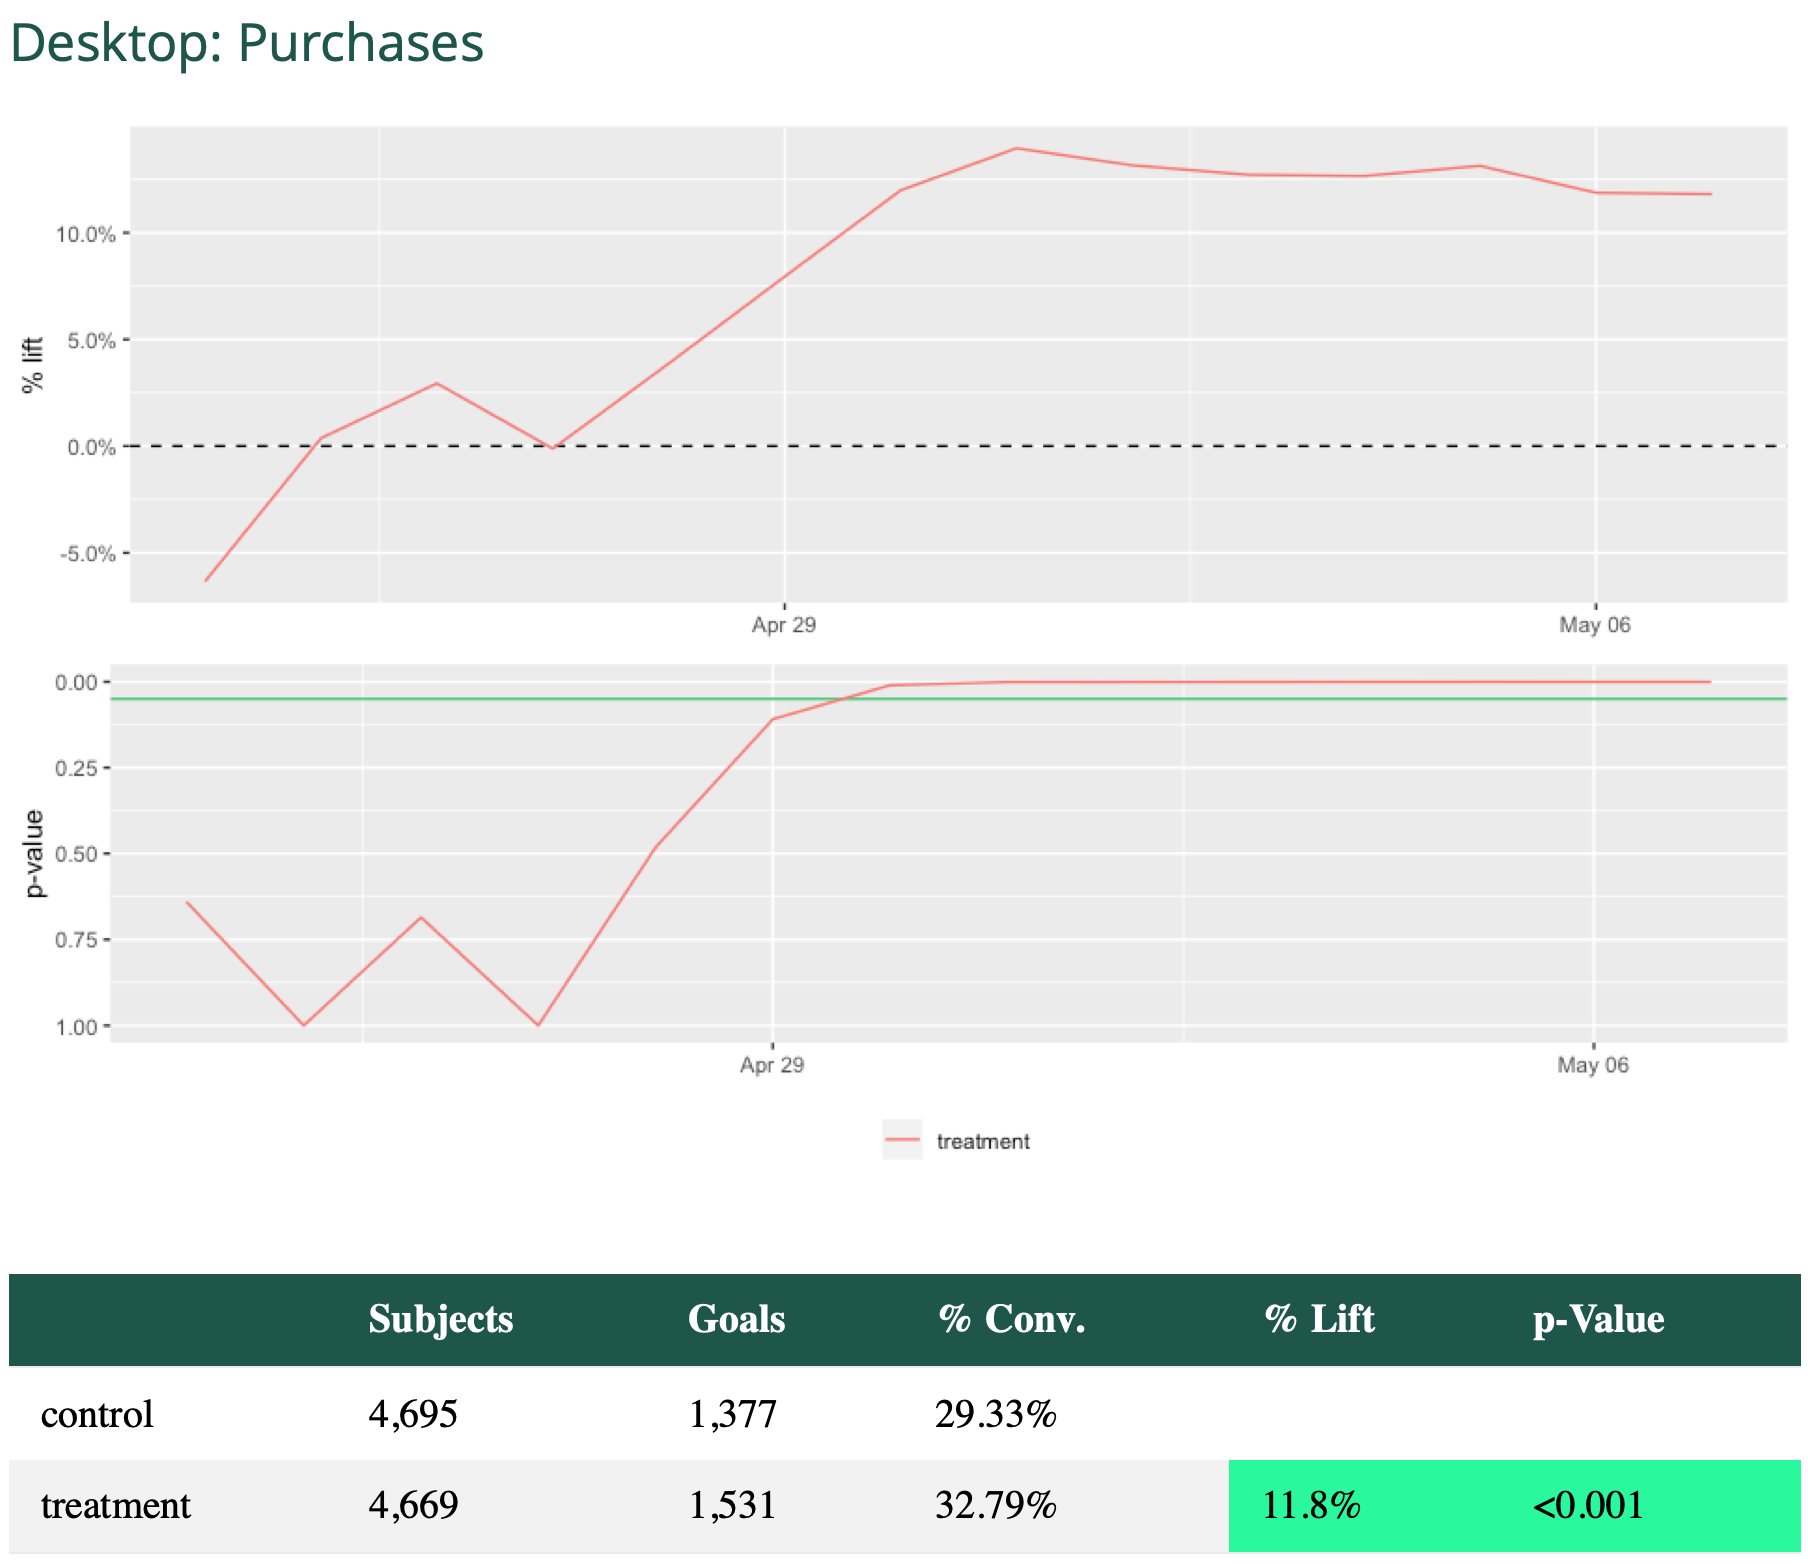
Detailed plot of recipes' performance relative to the control (dotted line in the chart above)
This can be generated simply through minimal R code:
# Experiment details

wave_params <- list(
  client_id = "mintmetrics",
  wave_id = "ex1",
  start_date = "2019-04-24 09:19:45",
  stop_date = "2019-05-15 14:29:00",
  time_grain = "hour",
  subject = "usercookie",
  recipes = c("control", "treatment")
)

# List of metrics to report on

goalList <- list(
  list(
    title = "Purchases",
    goal = "purchase %",
    operand = "like"
  ),
  list(
    title = "Desktop: Purchases",
    goal = "purchase %",
    operand = "like",
    segment_type = "device",
    segment_value = "Computer",
    segment_operand = "="
  ),
  list(
    title = "Mobile: Purchases",
    goal = "purchase %",
    operand = "like",
    segment_type = "device",
    segment_value = "Mobile",
    segment_operand = "="
  )
)
goalList <- mojitoFullKnit(wave_params, goal_list = goalList)
Learn more about Mojito R Analytics on Github.
Future work
Easy experiment dashboards in Superset
We use Apache Superset to collaboratively explore data with clients (ad hoc for complex tests). It's also useful for us as a testing business to see how many experiments we have active and informing us of any errors happening inside active tests.
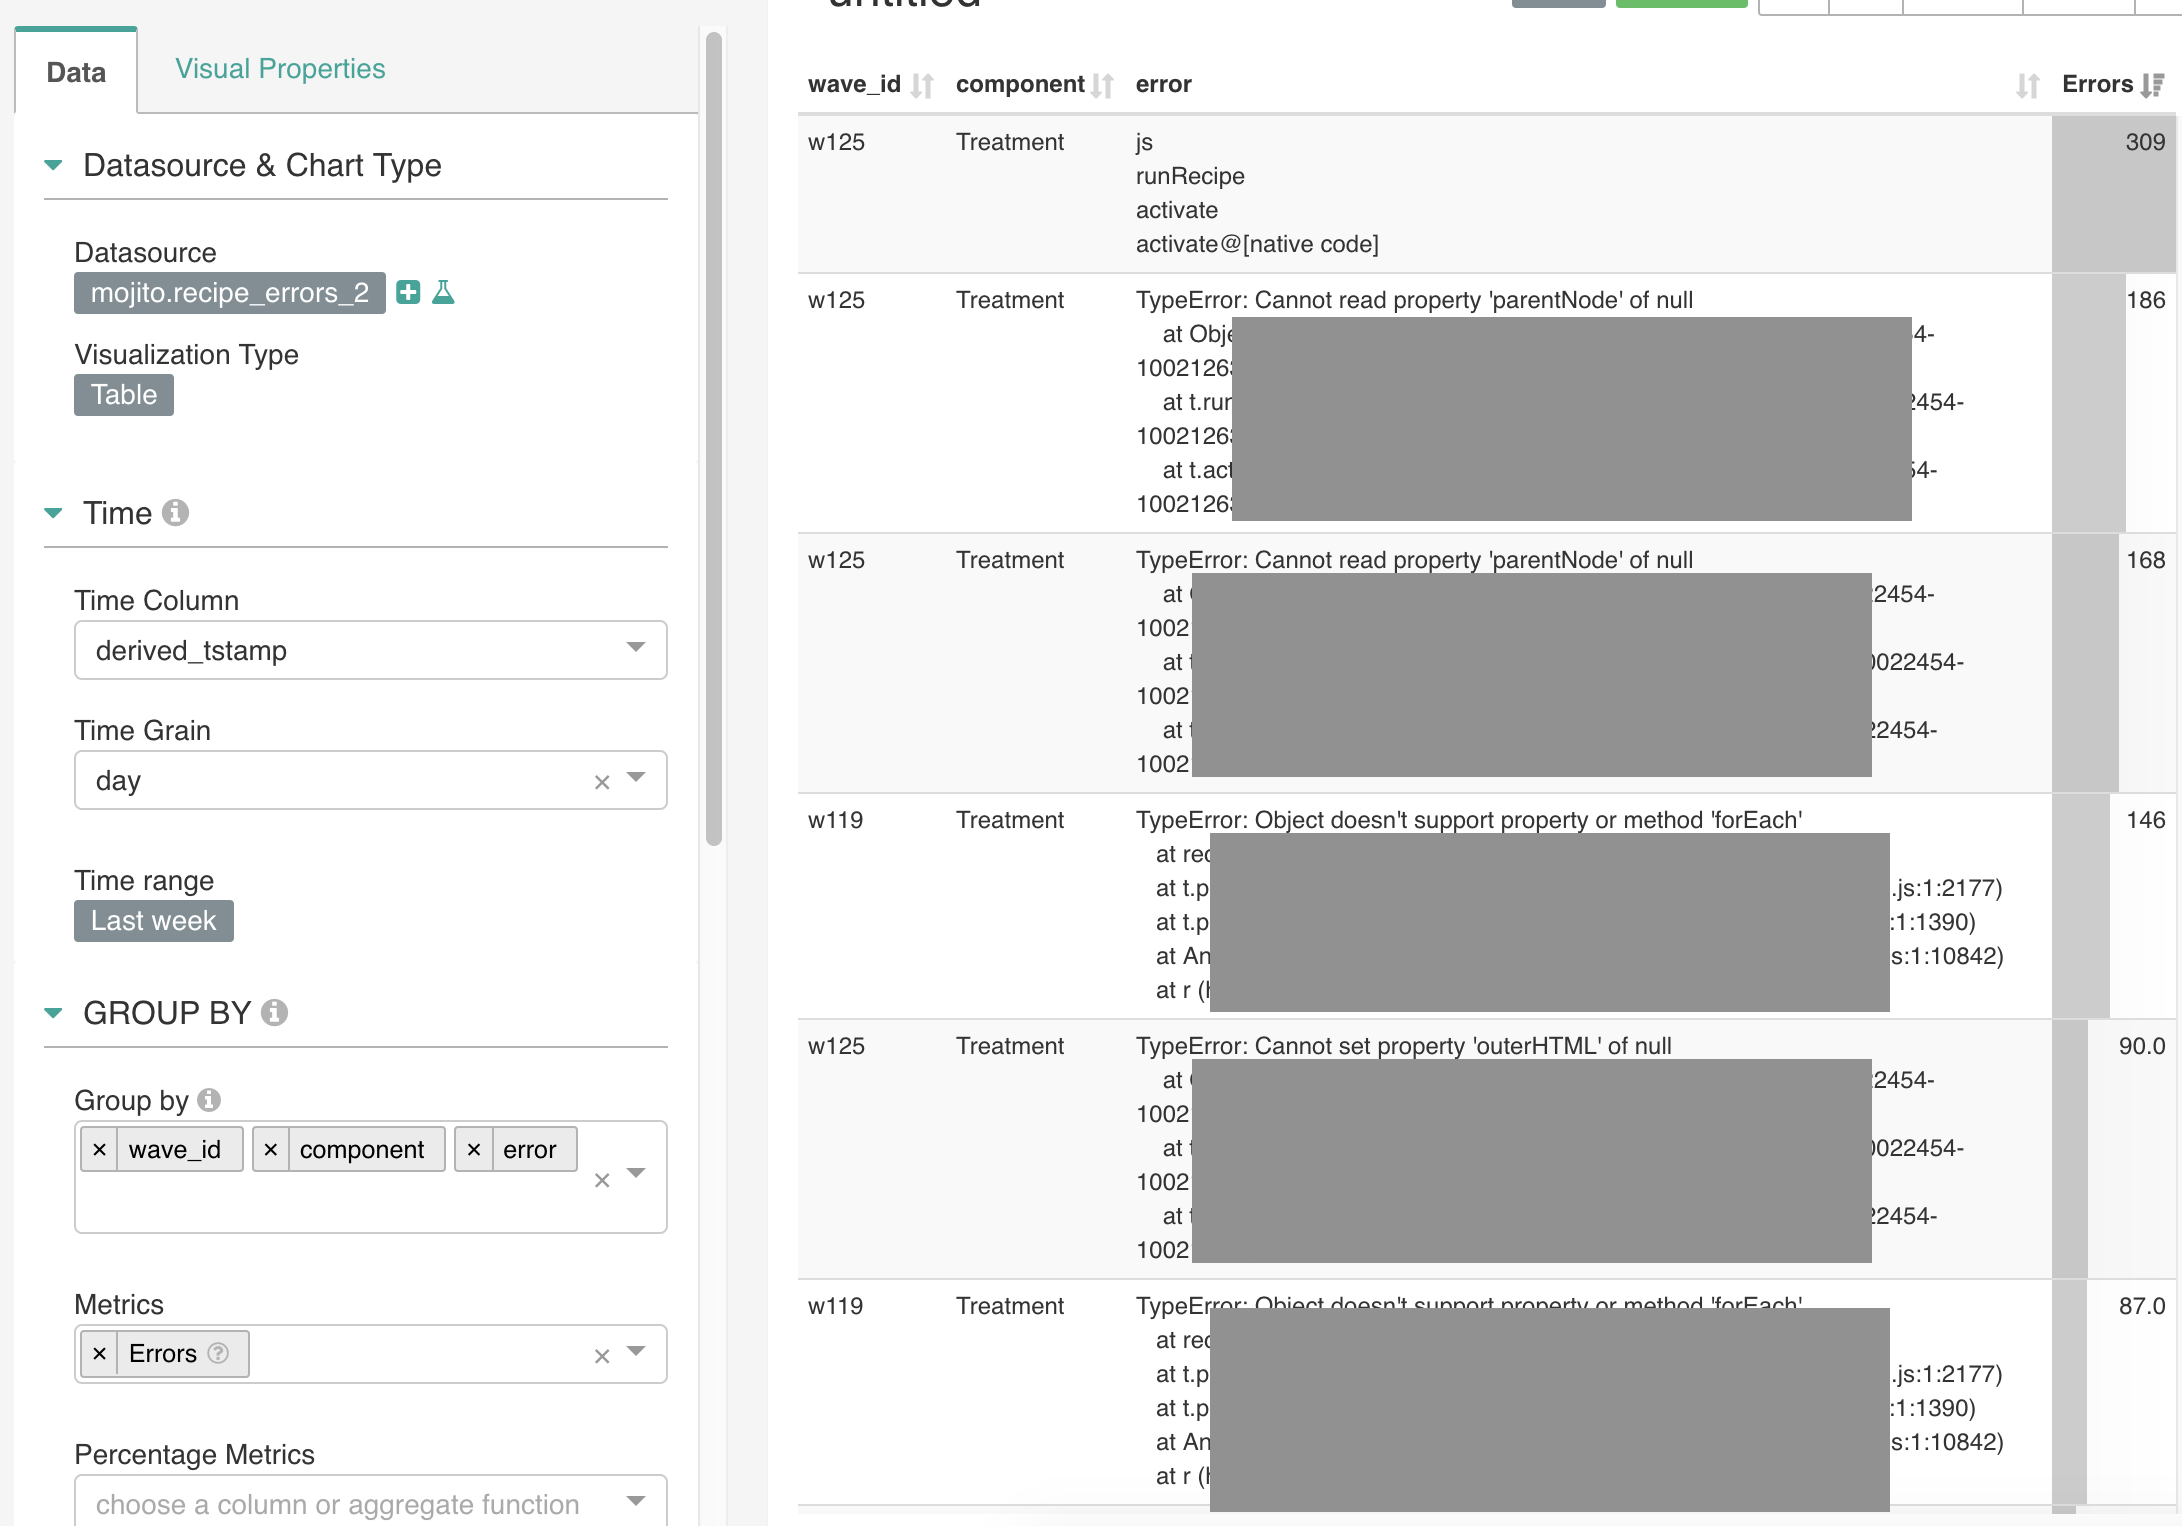
We already use Superset heavily for monitoring errors that arise in tests.
Someday, we'd like to build Mojito reports into Superset so our clients can build and manage their own reports from our data warehouse.
Decoupling Storage & Analytics components
Currently Storage and Analytics components are tightly coupled because we only use Snowplow and Redshift. When our Redshift RIs expire later this year, we may try Snowplow on GCP / Big Query. And if you're GA 360 / Big Query users, we'd love to help you get Analysis working on this storage target - some of our clients use this heavily.
Deterministic experiment / variant assignment
We've been interested for a while about using cookie or business user IDs as seeds to bucket users. This would make it possible to:
- Better estimate assignment for experiments
- Recalculate assignment during analysis (e.g. in case test exposure events were never sent for some reason)
- Assign treatments to different units like browser fingerprints, page URLs, session IDs or other bespoke units that aren't your typical "user-level" units.
- Reduce reliance on client-side set cookies as ITP wages war with first-party analytics tools
Ultimately, our development is fuelled by client needs, so we'll only get to these as needed - but add an issue to Github and we'll see if we can't help.
More libraries for 'Delivery' of tests across platforms and devices
Our business focuses on client-side experiments in web applications. But experiments are also useful on other platforms, like server-side, mobile apps etc. We'd love to support other platforms some day.
See Mojito on Github
Our stack is open for all to see and because it's BSD 3-Clause licensed, you can take it and build upon it as you like.